Effective monitoring and anomaly detection within a data environment are crucial, particularly in today’s data-driven landscape. At Imperva Threat Research, our data lake serves as the backbone for a range of critical functions, including threat hunting, risk analysis, and trend detection. However, with the daily addition of 2 terabytes of data and the management of thousands of tables, this task becomes intricate and resource-intensive. In this blog post, we delve into the complexities and strategies of managing such a vast data ecosystem efficiently.
When you have a lot of data, how do you find interesting anomalies? What baseline are you using? Who defines what’s interesting? To address these problems, we created a generic platform where each user can easily define the baseline data points they want to track over time. Then, we applied several anomaly detection techniques and enabled push notifications for individual alerts.
We stored daily counters on millions of different entities like customers, security rules, and more. We aggregated these counters into weekly and monthly counters to get more perspectives on the data. Finally, we monitored the counters we stored, to get insights on the data.
Several factors – the high number of different counters, the daily batch insert of large amounts of data, and the expected usage of the data – all point to a data lake-based solution. We moved workloads of similar data from databases to our data lake, and the resulting solution was cost effective and flexible, with the ability to choose a query engine per use case.
We decided to use an SQL-based engine, and store the data from our counters in the data lake. It allowed us to meet our financial and technical requirements with the same technology stack we already used. The SQL engine allowed us to both collect the relevant data and later perform aggregation and anomaly detection. We used data optimization techniques including partitions, bucketing, and a columnar file format to get to an effective solution from both the performance and storage perspective.
The framework we created has a streamlined counters process using configuration files and data containing many counters and valuable anomalies. The data is saved in dedicated data lake tables, which are accessed by the framework and can also be used in other use cases.
We will explain the whole process – from collection to aggregation and anomaly detection – all done by SQL using a lightweight process which relies on the SQL engine’s built-in capabilities. Read more to learn about our framework, including configuration and code snippets, as well as examples of data and anomalies.
Architecture and Data Flow
We wanted to make the process effective by making our queries light and simple. We did that by saving a copy of the data, grouped by day, in our data lake, which resulted in a lightweight detection process with effective performance and costs.
First, we extracted statistical information from the data on a daily basis. These types of operations usually require grouping and are quite heavy, but because we perform them only once on the source data and in short periods, it becomes virtually negligible. We collected different counters like the number of security events, maximum size of an attack,and many more. There are user-defined counters that are collected globally, per customer, per attack, per country, per industry tool and even for different tuples like customer-attack or attack-country and more. From here, since the data is already grouped in statistical information, we can analyze this data rather than running heavy queries every time we need to gather information.
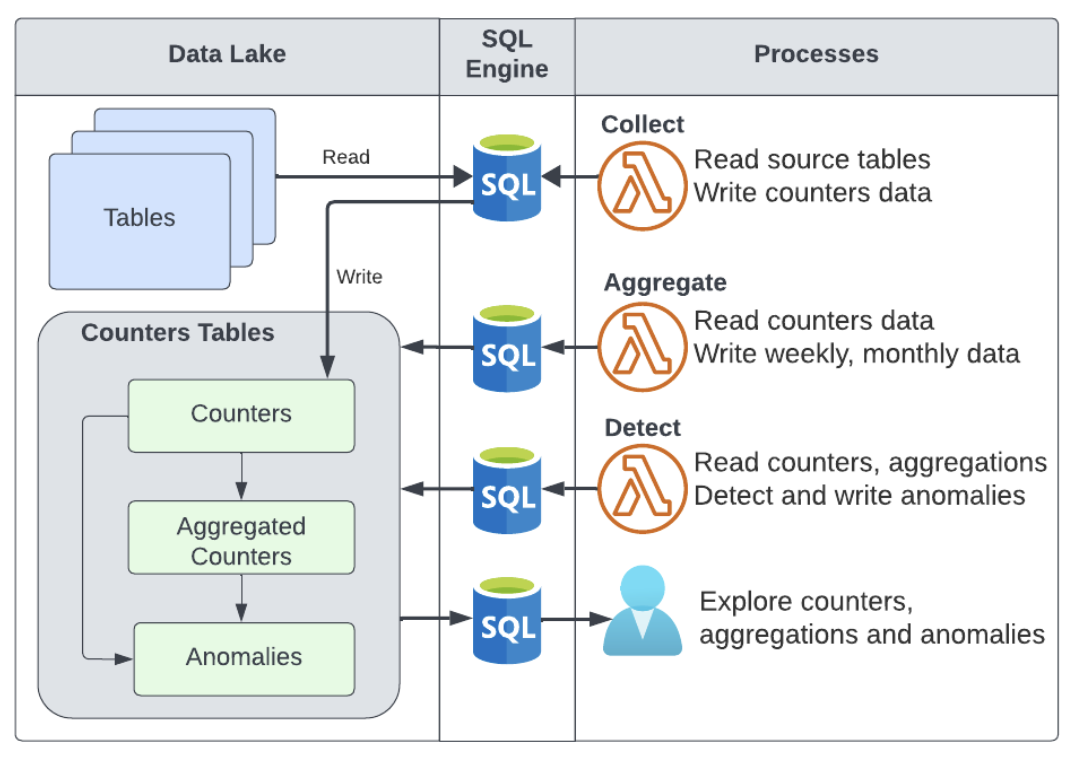
The data is collected from the source tables on a daily basis into the daily counters table. From there, the data gets to the aggregation and anomalies tables by different processes. All the data is accessible, as it is stored in data lake tables.

Figure 1: Collection, aggregation and anomaly detection flow
We used a cloud object store, a managed query engine, and a Lambda function for a completely serverless solution. It makes the solution easy to deploy on multiple cloud regions and cloud accounts. We run scheduled batch operations for sets of counters. We added retries for all operations for robustness, and the Lambda function can also be called manually for maintenance operations.
Examples of Data and Anomalies
To help visualize this process, we’ll explain an example where we’d like to find an emerging threat (global anomaly) using data on the number of times Imperva Cloud WAF detected a vulnerability exploit attempt in a single day. Many vulnerabilities have a public CVE, and we count the number of attacks.
| Day | CVE | Attacks |
| 2023-01-01 | CVE-2020-9757 | 22,034 |
| 2023-01-01 | CVE-2020-6287 | 10,041 |
Another type of data we have is daily security incidents, which are clusters of attacks. The clustering is done by time, attack type, attack tool, and other features. We can group the data according to attack type, attack tool, attacked industry, and more. Below is an example.
| Day | Industry | Security Incidents |
| 2023-01-01 | Financial Services Industry | 101,233 |
| 2023-01-01 | Sports | 30,343 |
Based on the data we have in our data sources, we detect anomalies by inserting data into a dedicated table. Then, we run a query which returns anomalies. We have different anomaly detection methods, such as maximum in a given period, percent change from average, and more. Below are some anomaly examples.
| Dataset | Interval | Type | Counter | Value | Details |
| CVE | Day | Max | CVE-2020-9757 | 22,034 | Previous max: 21,044Age: 250 daysIncrease: 4% |
| Incidents | Week | Max | Industry: Sports | 29,122 | Previous max: 28,434Age: 50 weeksIncrease: 2% |
| CVE | Week | Distance from average | CVE-2020-6287 | 49,888 | Weekly average: 30,055Distance: +65 % |
| Incidents | Week | Trend | Attack Type: SQL Injection | 1,320,324 | Constant increase in the last 10 weeks |
Below is an example of a detected anomaly based on distance from average.

The detected anomaly is based on the weekly sum of the data. The average is calculated according to the last 30 weeks. The highlight shown above is a 115% change above average on the week starting on 2023-10-30.
Configuration
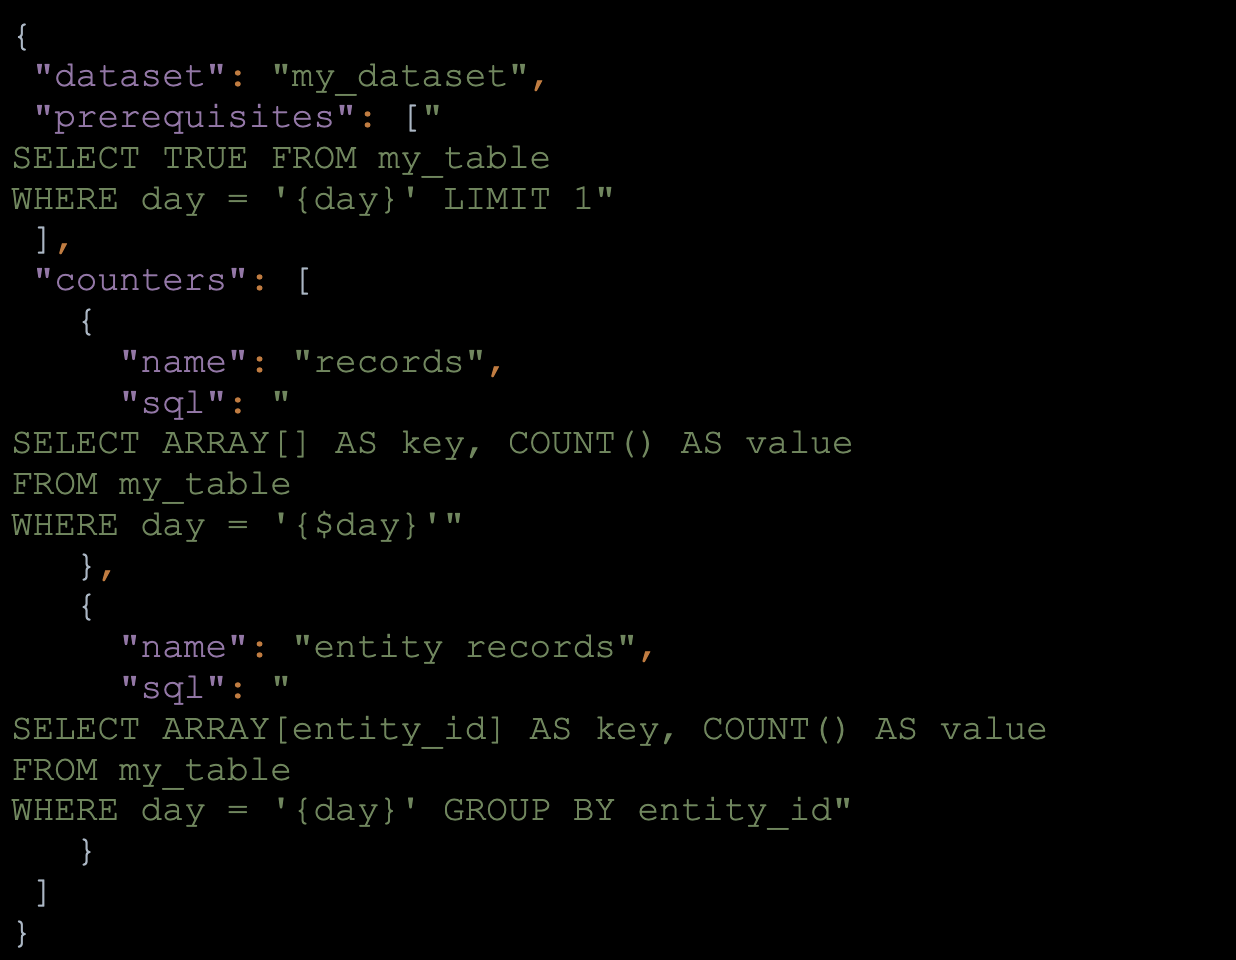
We defined datasets as groups of counters, and each dataset configuration is stored in a JSON file. Once a dataset is added to the engine, counters are collected and aggregated, and anomaly detection is done on the data.
Below is an example dataset file, which contains a prerequisite definition and two counters. The prerequisite query is used to make sure data is available before the collection process starts. The collection process goes over the counter’s definition and writes daily data to the daily counters table. Each counter has a key, which is defined by an array of values:

Figure 2: Dataset configuration file example
Using configuration files allowed our team to add counters without code changes. Once a counter’s data is collected, the data is aggregated and anomalies are detected.
Aggregation
We wanted to monitor weekly and monthly data. For example we wanted to detect sequences of attacks and not only daily peaks. For that, we created a weekly counters table which we populated based on the daily counters table, shown in the example below.

Figure 3: Aggregate daily data to weekly data
We have a similar process for the monthly aggregation. The data flows to the aggregated tables without having to query the source tables.
Anomaly Detection Methods
For the anomaly detection we used several SQL-based detection methods. Here are some examples of the techniques we use:
- Distance from the relative standard deviation (RSD), empirical rule or Interquartile range (IQR)
- Trend detection using linear regression slope (using the REGR_SLOPE function)
- Pattern detection (using the MATCH_RECOGNIZE function, see example)
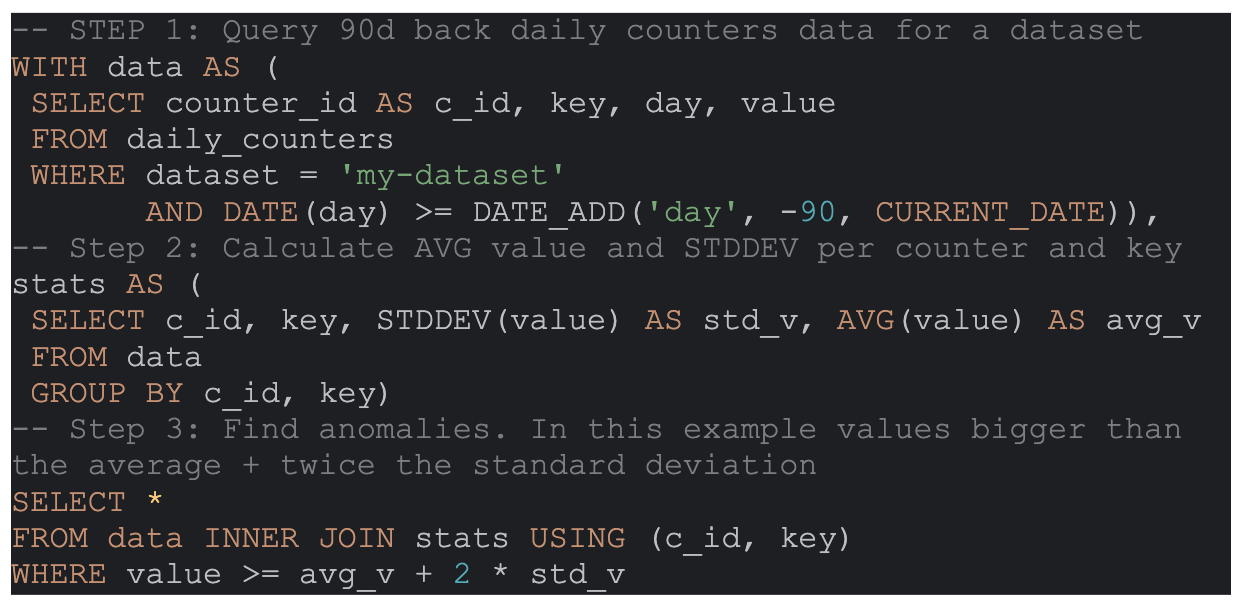
Below is an example of a detection query, which runs on all counters of a dataset for 90 days back. It calculates statistics and returns anomalies. In this example, the anomalies are values higher than the z-score of 2 (the average value + 2 times the standard deviation):

Figure 4: Detection query example
We have multiple detection queries, which run on all of our dataset counters and aggregation tables, producing millions of anomalies. We search for anomalies using the query engine, and also export them for usage in our products.
SQL engines are very powerful and have many functions you can use to aggregate your data and detect anomalies efficiently. As an example, look at Trino’s aggregation function list which keeps updating over time, and offers powerful aggregation tools.
Takeaway
The framework we created has a straightforward counters collection process using configuration files. The framework’s data contains many different counters, aggregated data, and valuable anomalies. The data is saved in dedicated data lake tables, which are accessed by the framework and are used in other use cases as well.
We used managed services for a complete serverless and pay-per-usage solution, which made it easy to deploy the framework on multiple cloud regions and accounts. We search for anomalies using the query engine, and implement alerts based on anomalies. We also export data for usage inside of our products.
You can implement similar concepts on your own data. We suggest starting by creating a counters table, filling it with some data, and running an example anomaly detection query on it.
https://www.imperva.com/blog/threat-hunting-through-anomaly-detection-on-your-data-lake/